Athena Spark
Athena Spark
In this workshop, we will explore the features of Amazon Athena for Apache Spark and run hands-on labs that demonstrate features and best practices. By the end of the workshop, you will be able:
Create an Amazon Athena workgroup with Spark as the analytics engine Create notebooks and run calculations in notebook Use Cloudwatch logs for monitoring and debugging
Amazon Athena for Apache Spark provides interractive analytics under a second to analyze petabytes of data using open source spark framework.Interactive Spark applications start instantly and run faster with our optimized Spark runtime, so you spend more time on insights, not waiting for results. Build Spark applications using the expressiveness of Python with a simplified notebook experience in an Athena console or through Athena APIs. With the Athena serverless, fully managed model, there are no resources to manage, provision, and configure and no minimum fee or setup cost. You only pay for the queries that you run.
Knowledge of Spark , Python/Scala are useful but not a pre-requisite for this workshop
- You download Notebook
Create Spark workgroup and Notebook
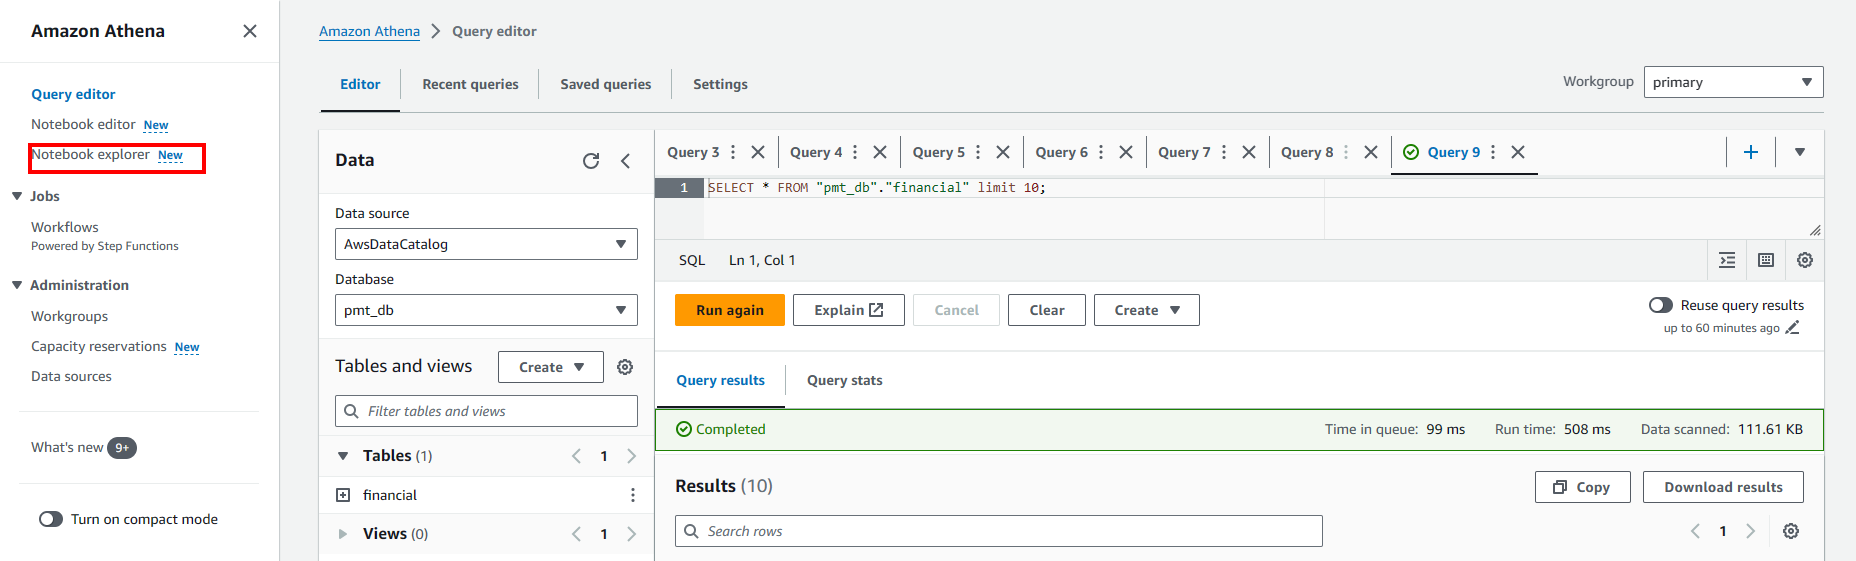
- Access the Athena Notebook console
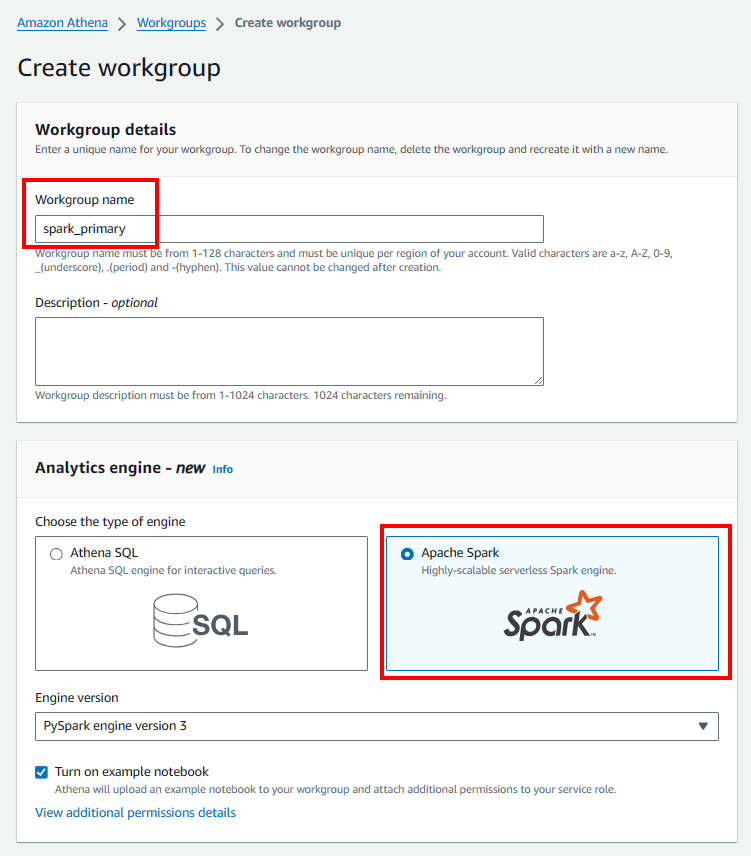
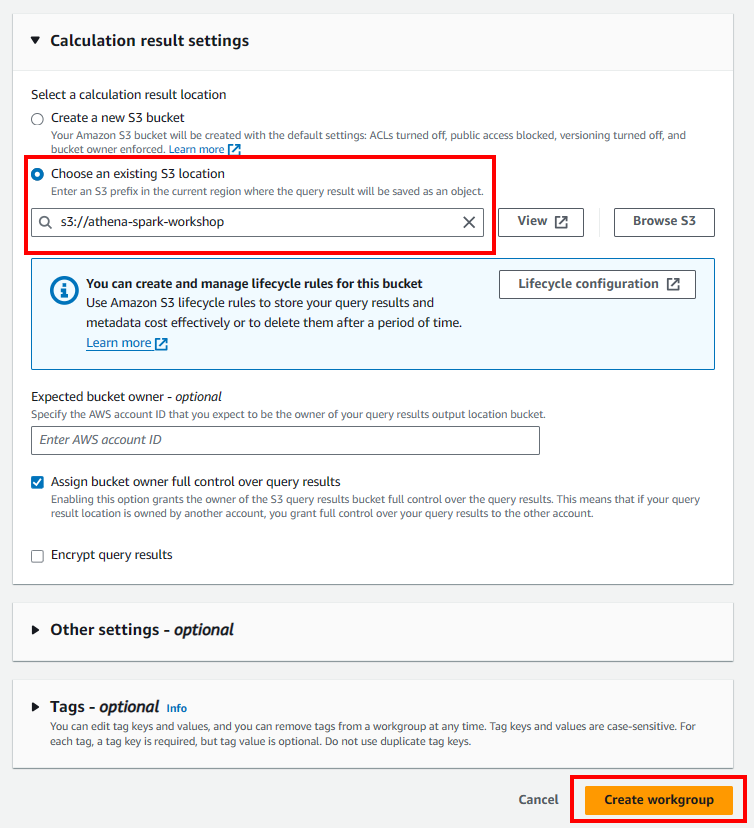
- Create Spark workgroup
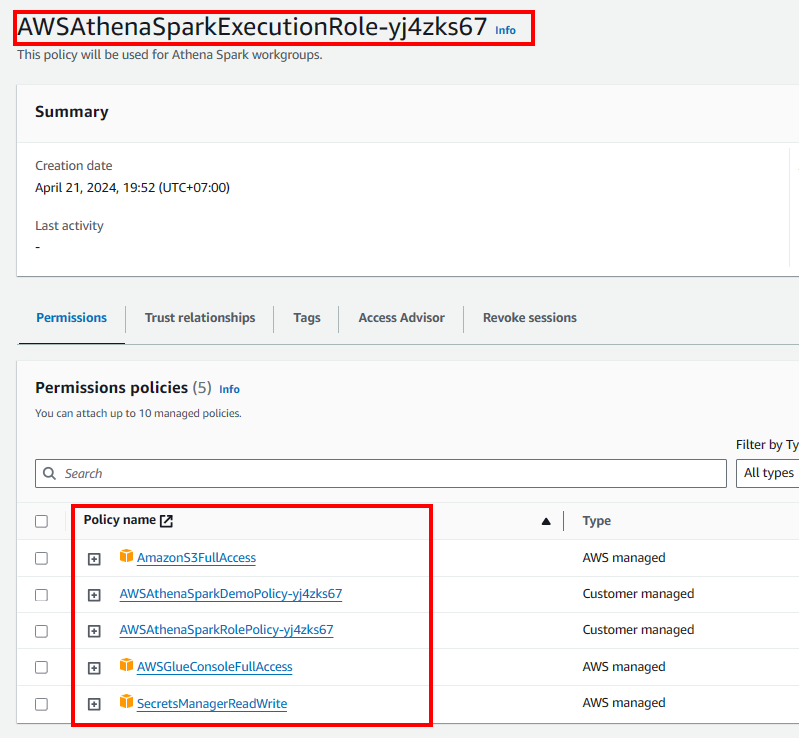
Update IAM role of Athena Spark
- Access the IAM console.
- On the left navigation bar, select Roles
- Choose Role was created by Athena
- Add all permission we need
Execute Notebook
-
Import Notebook:
- Access the Notebook explorer.
- Choose Import file
- Upload your notebook
-
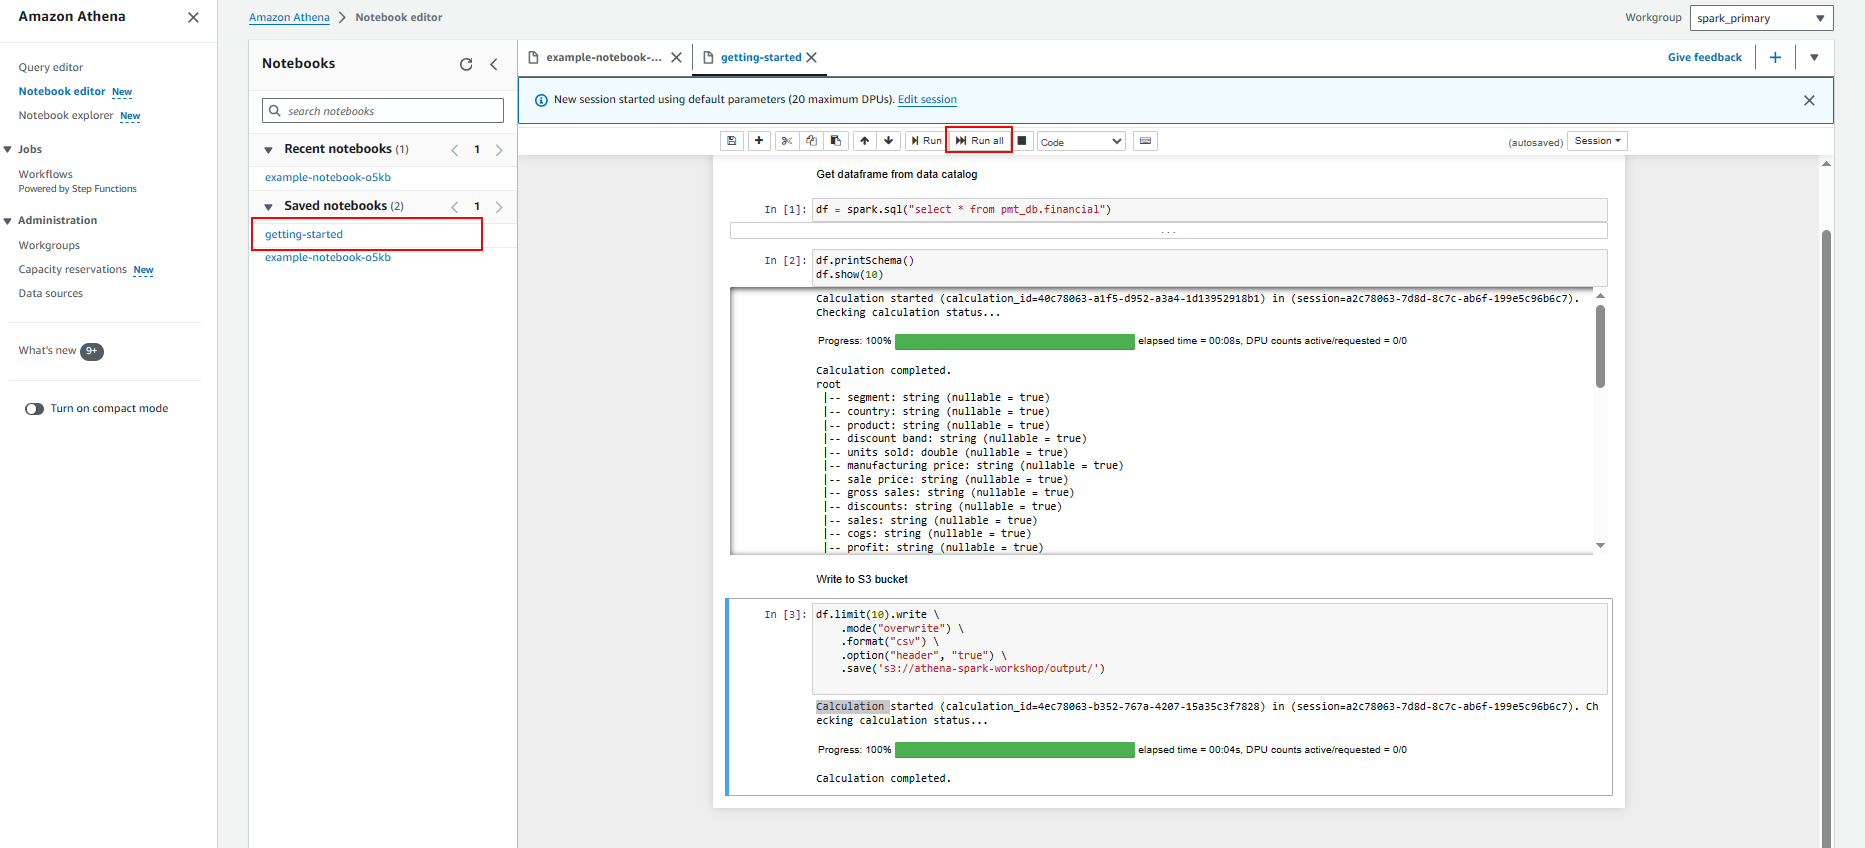
Start query in notebook
- Get Dataframe from glue data catalog
-
Data preparation and exploration
In this Lab we will show how to use Amazon Athena for Apache Spark to interactively run data analytics and exploration without the need to plan for, configure, or manage resources.
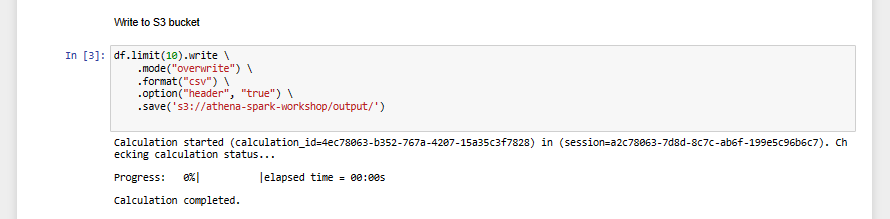
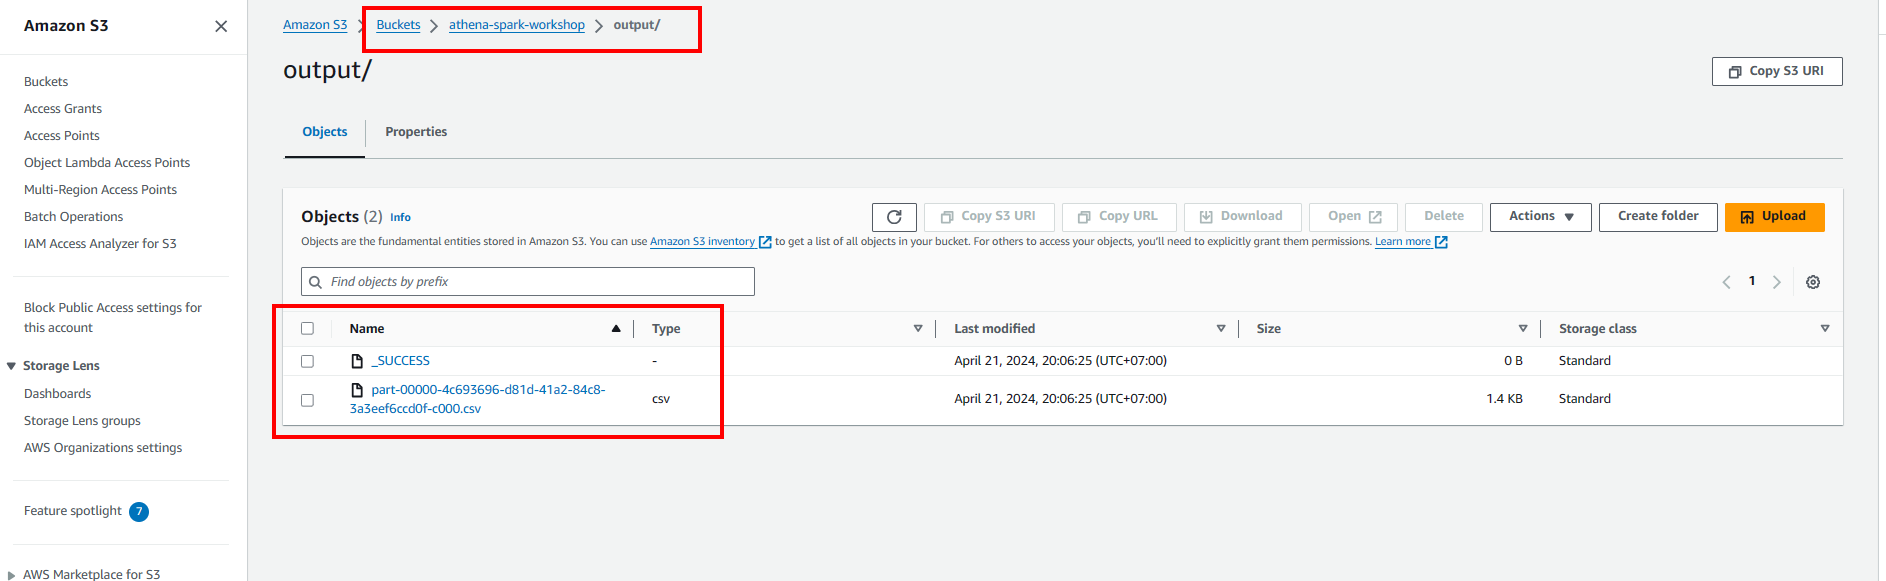
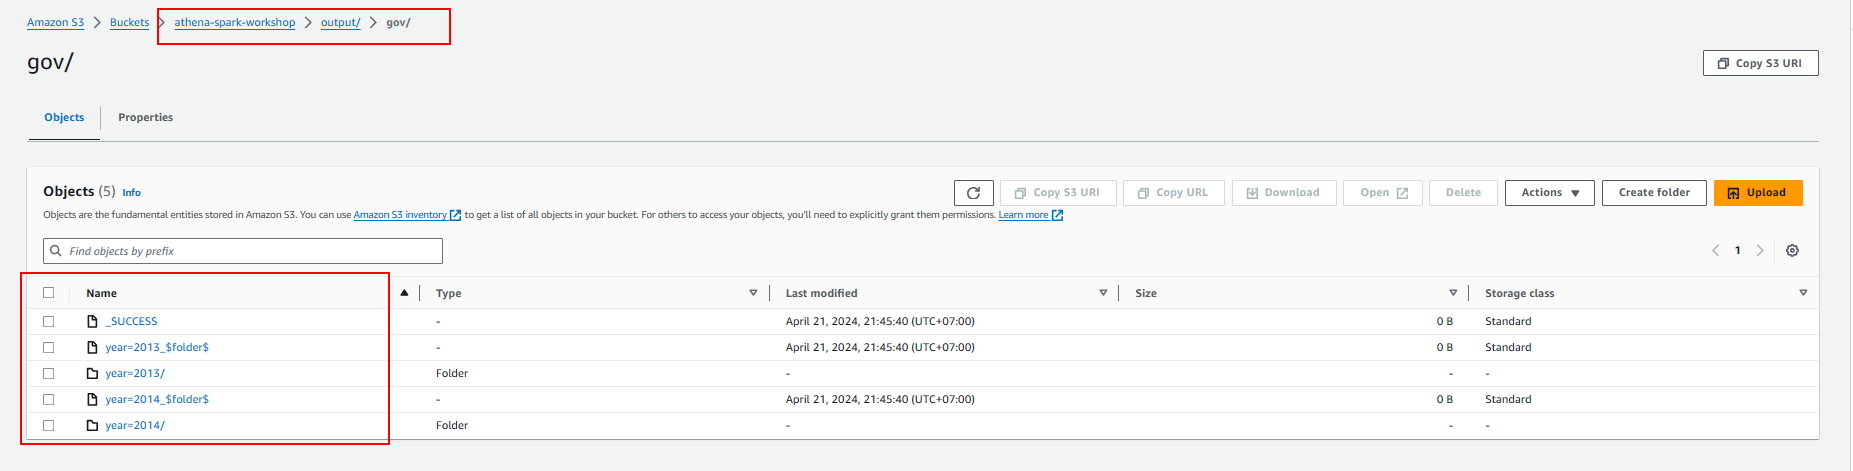
- Write to S3 bucket
- Analyze data from Government
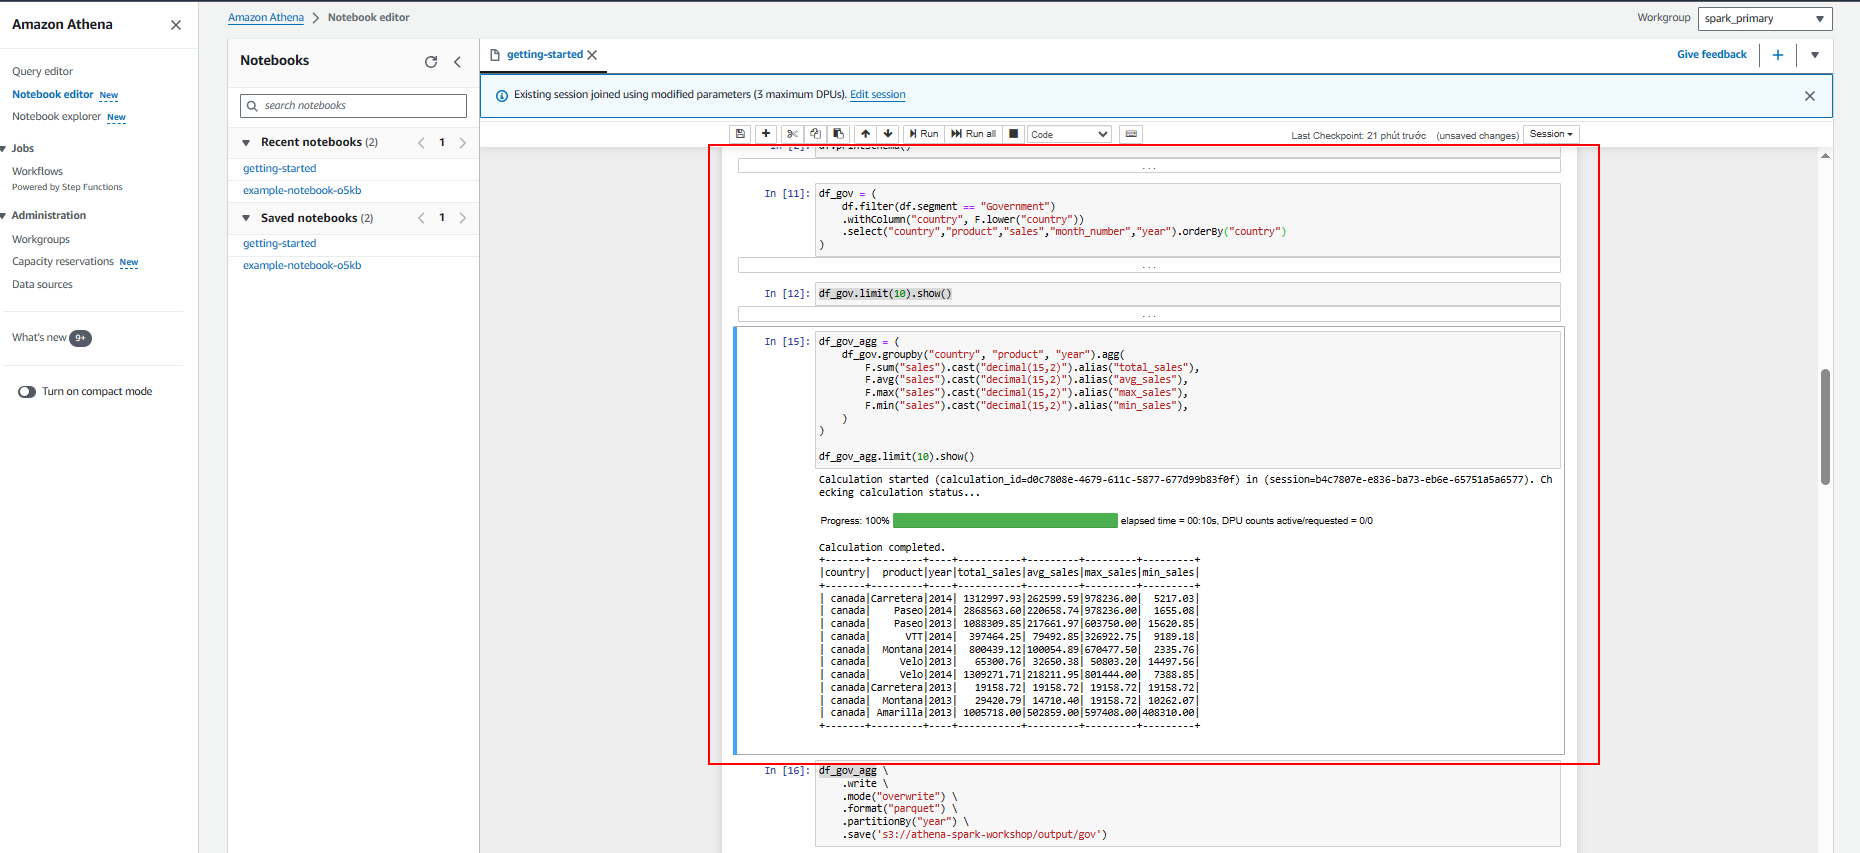
- Create table in glue data catalog so we can also query data using Athena Query Editor.
-
Build Visualizations
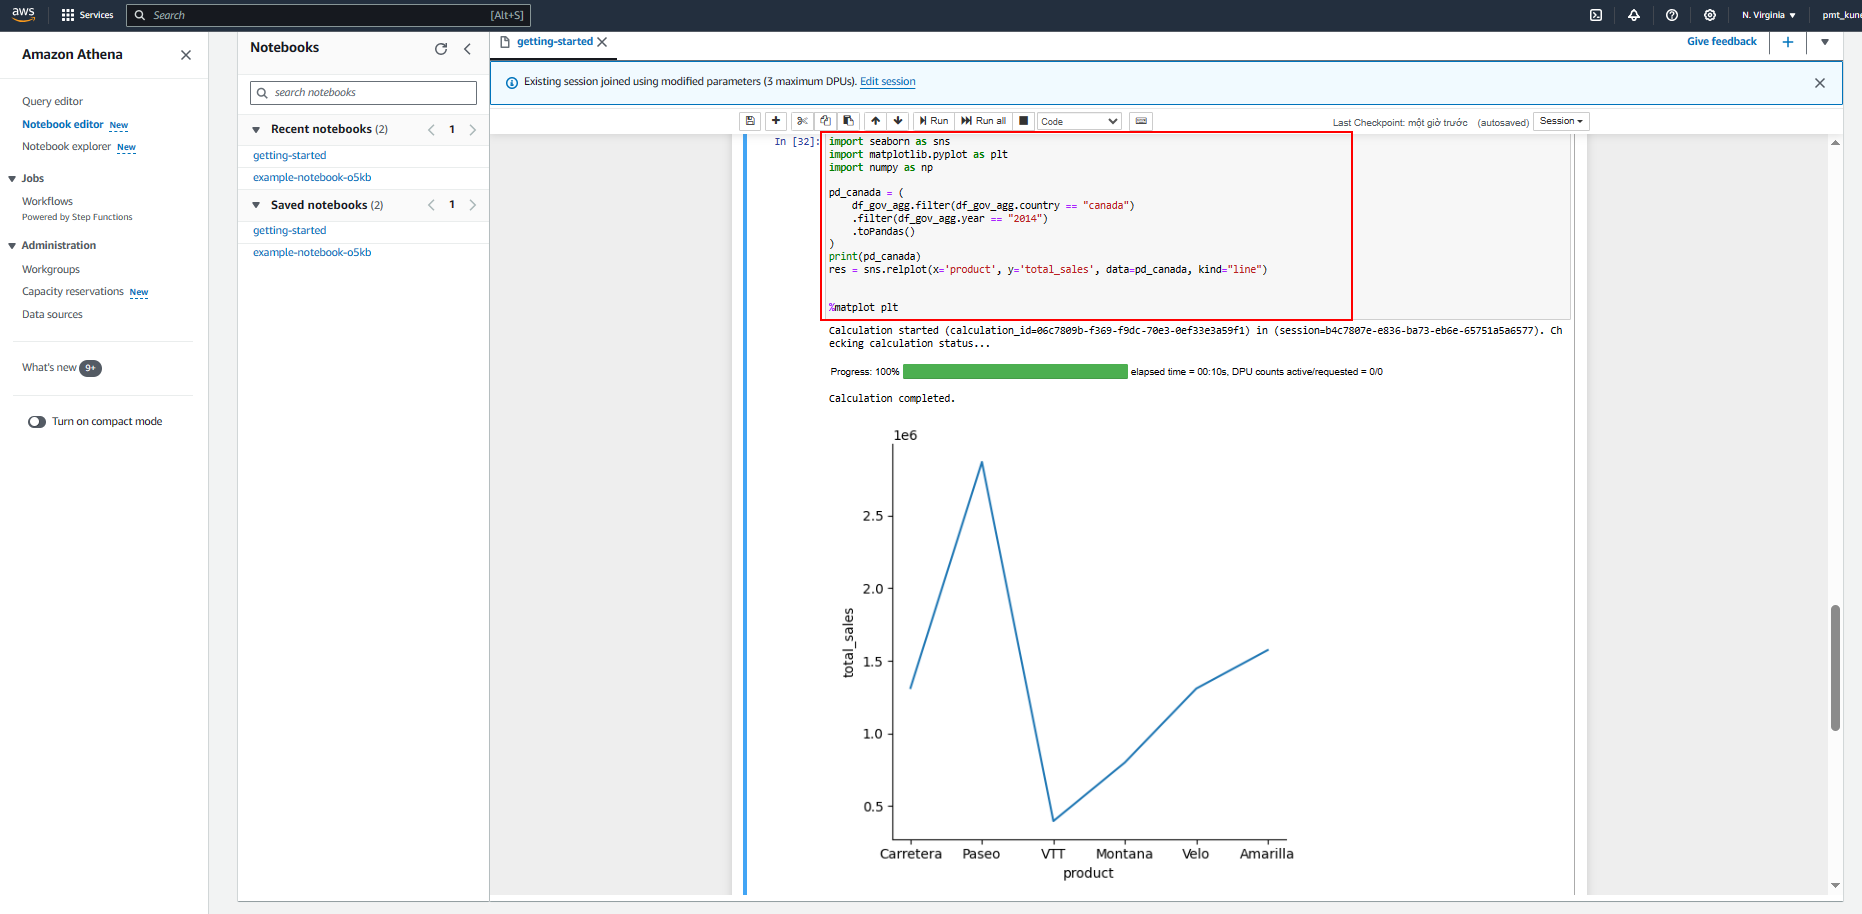
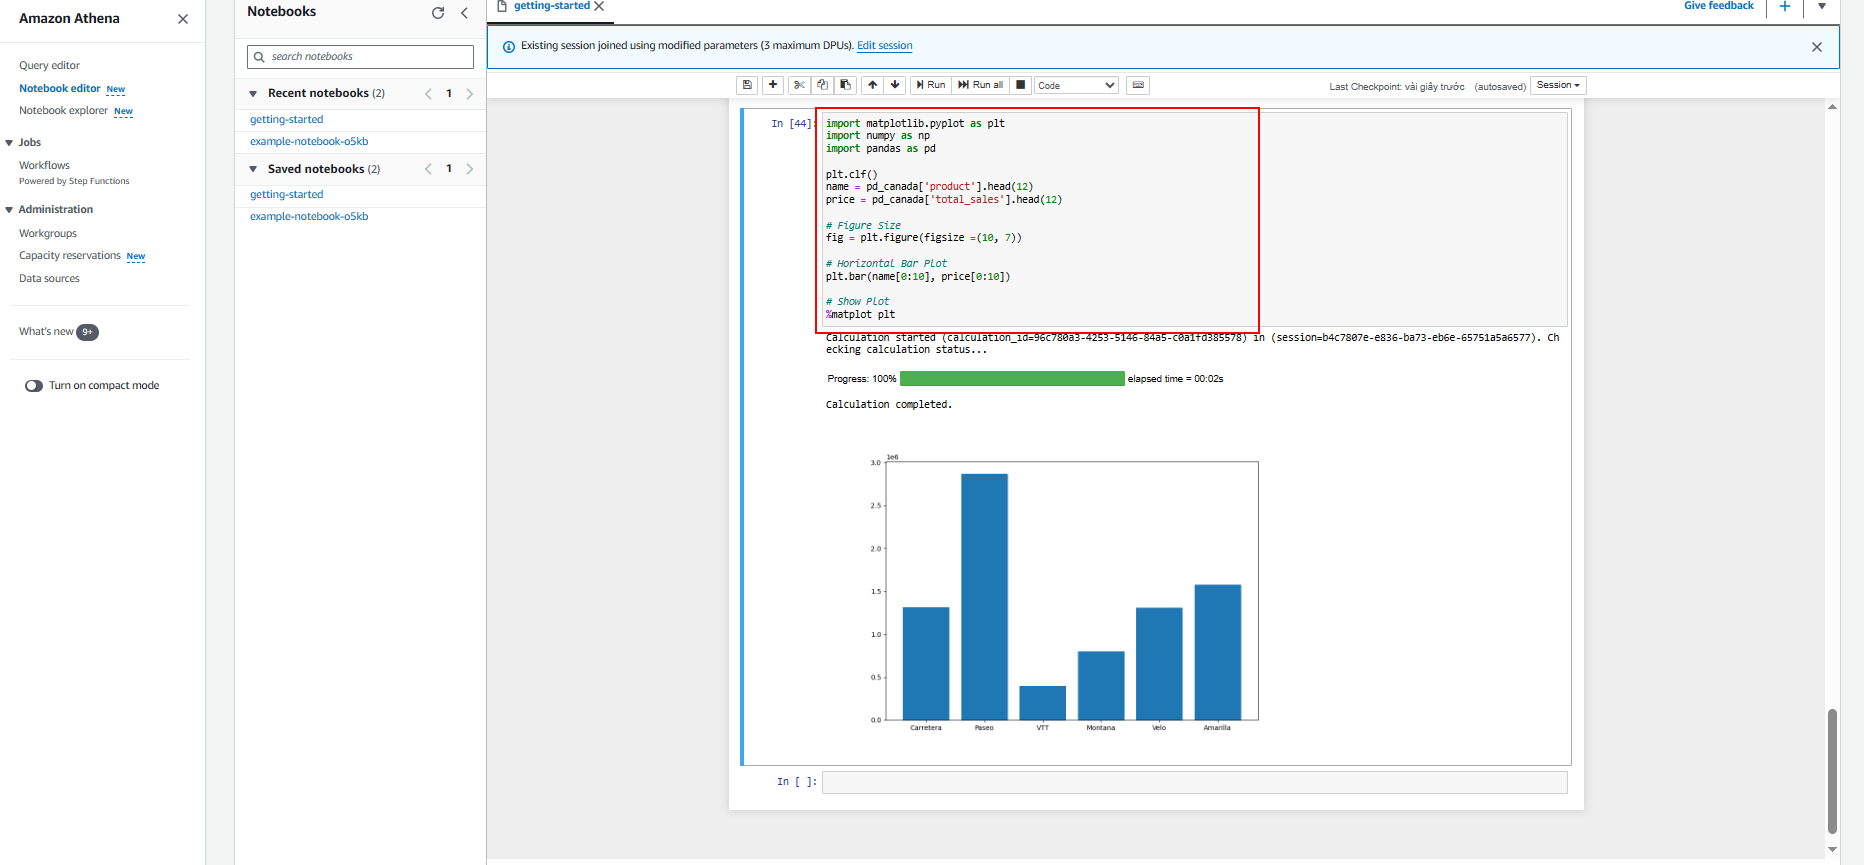
In this lab we will show how to build visualization in Amazon Athena for Apache Spark using Matplotlib and Seaborn.
Matplotlib is a comprehensive library for creating static, animated, and interactive visualizations in Python. Matplotlib helps to
- Create publication quality plots .
- Make interactive figures that can zoom, pan, update.
- Customize visual style and layout .
- Export to many file formats .
- Embed in JupyterLab and Graphical User Interfaces .
- Use a rich array of third-party packages built on Matplotlib.
Seaborn is a library for making statistical graphics in Python. It builds on top of matplotlib and integrates closely with pandas data structures.
- Use Seaborn to build visualization on this data
- Build visualization using Matplotlib
-
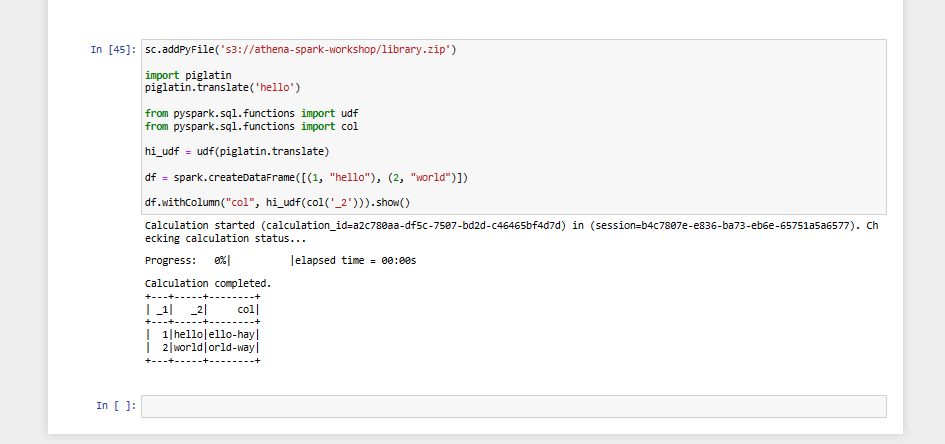
Installing Additional Python Libraries In this lab we will show how to import additional Python libraries to Amazon Athena for Apache Spark. We will use pip command to download a Python .zip file of the bpabel/piglatin project from the Python Package Index PyPI .
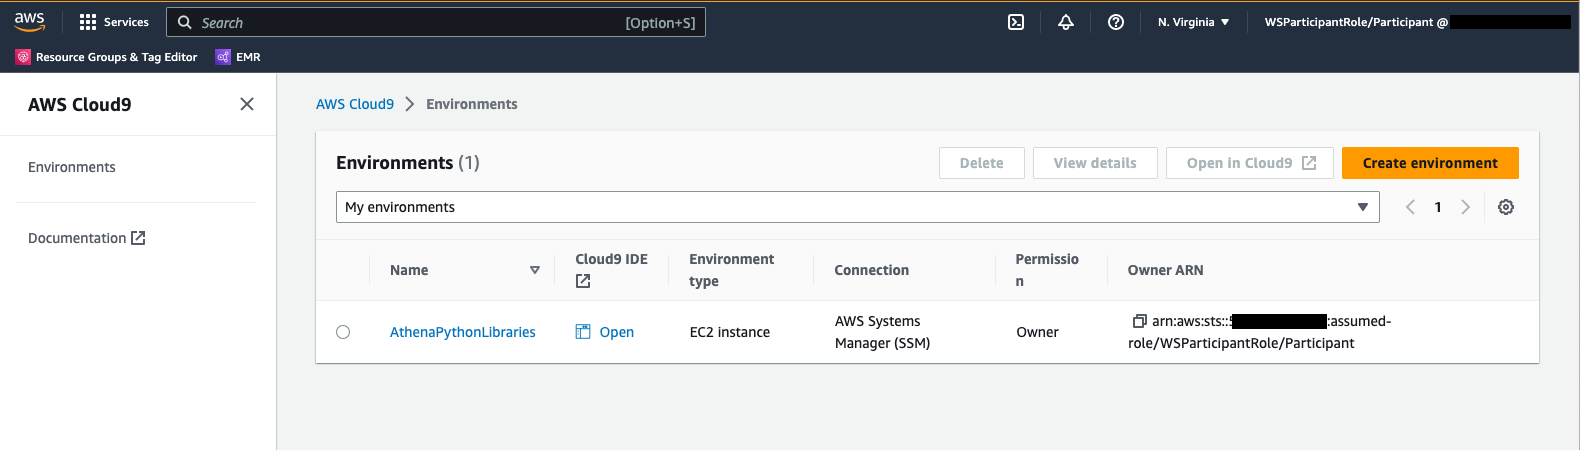
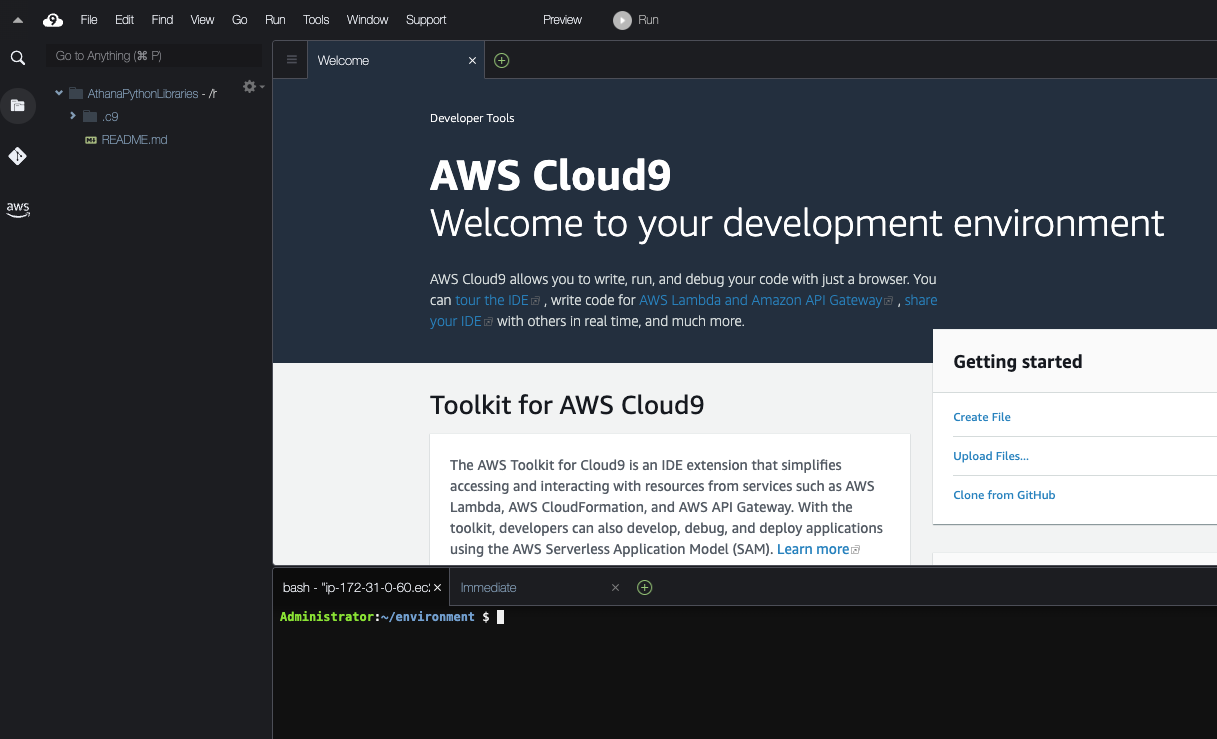
- Access the AWS Cloud9.
- Access your environment
mkdir testpiglatin
cd testpiglatin
virtualenv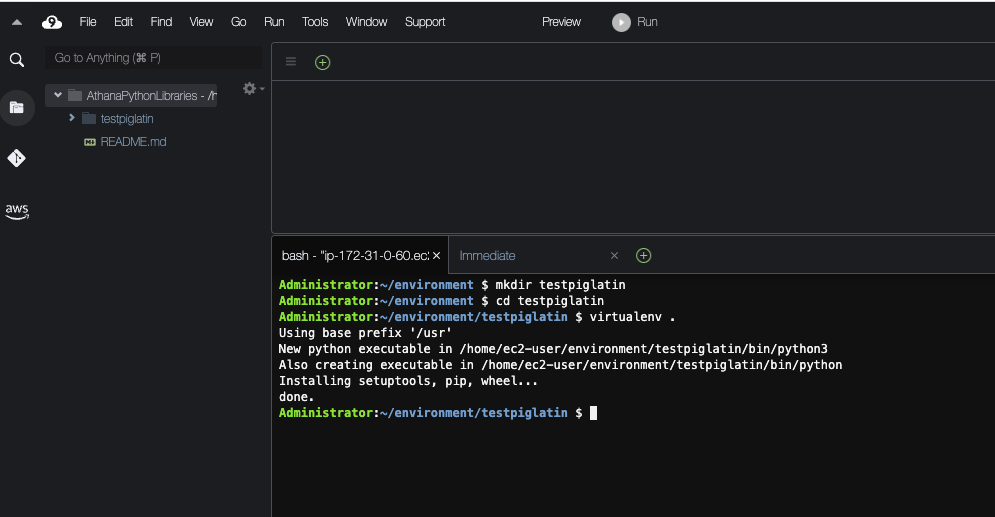
- Create a subdirectory named unpacked to hold the project and Use the pip command to install the project into the unpacked directory
mkdir unpacked
pip install -t $PWD/unpacked piglatin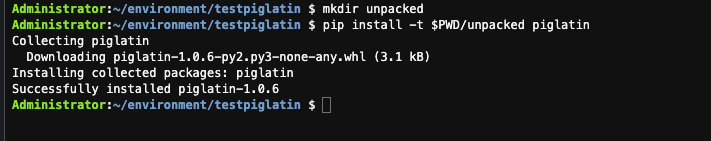
- Change to the unpacked directory and display the contents.
cd unpacked
ls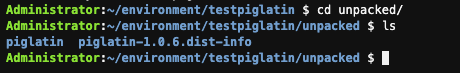
- Use the zip command to place the contents of the piglatin project into a file called library.zip, this will will be created under testpiglatin directory.
zip -r9 ../library.zip *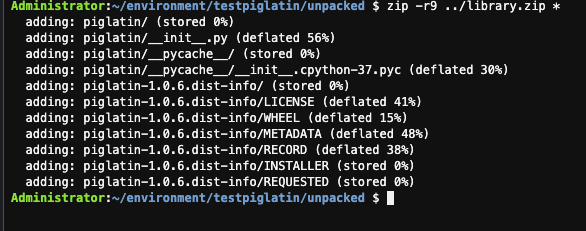
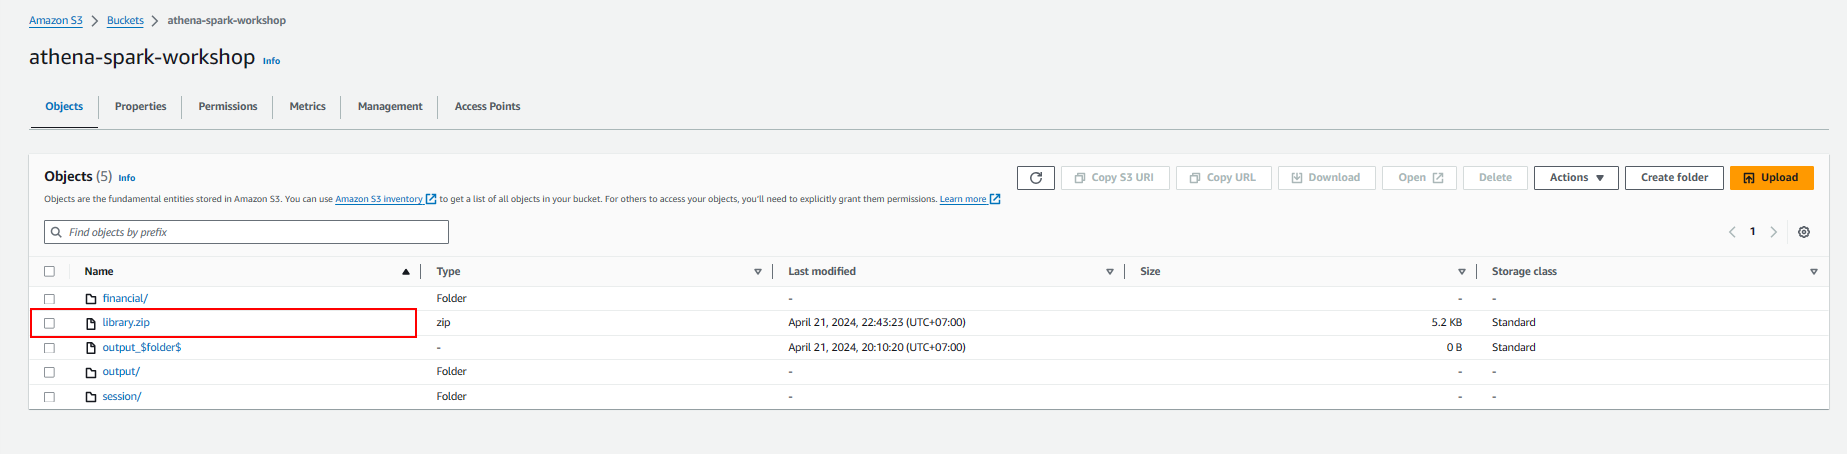
- Copy the library.zip file into Amazon S3 bucket created in your AWS Account, replace the account-id with your AWS Account ID
cd ..
ls
aws s3 cp library.zip s3://athena-spark-workshop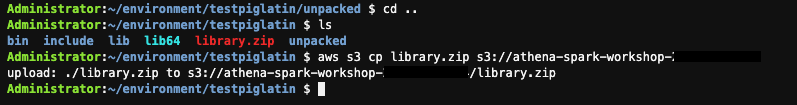
- Execute notebook
-
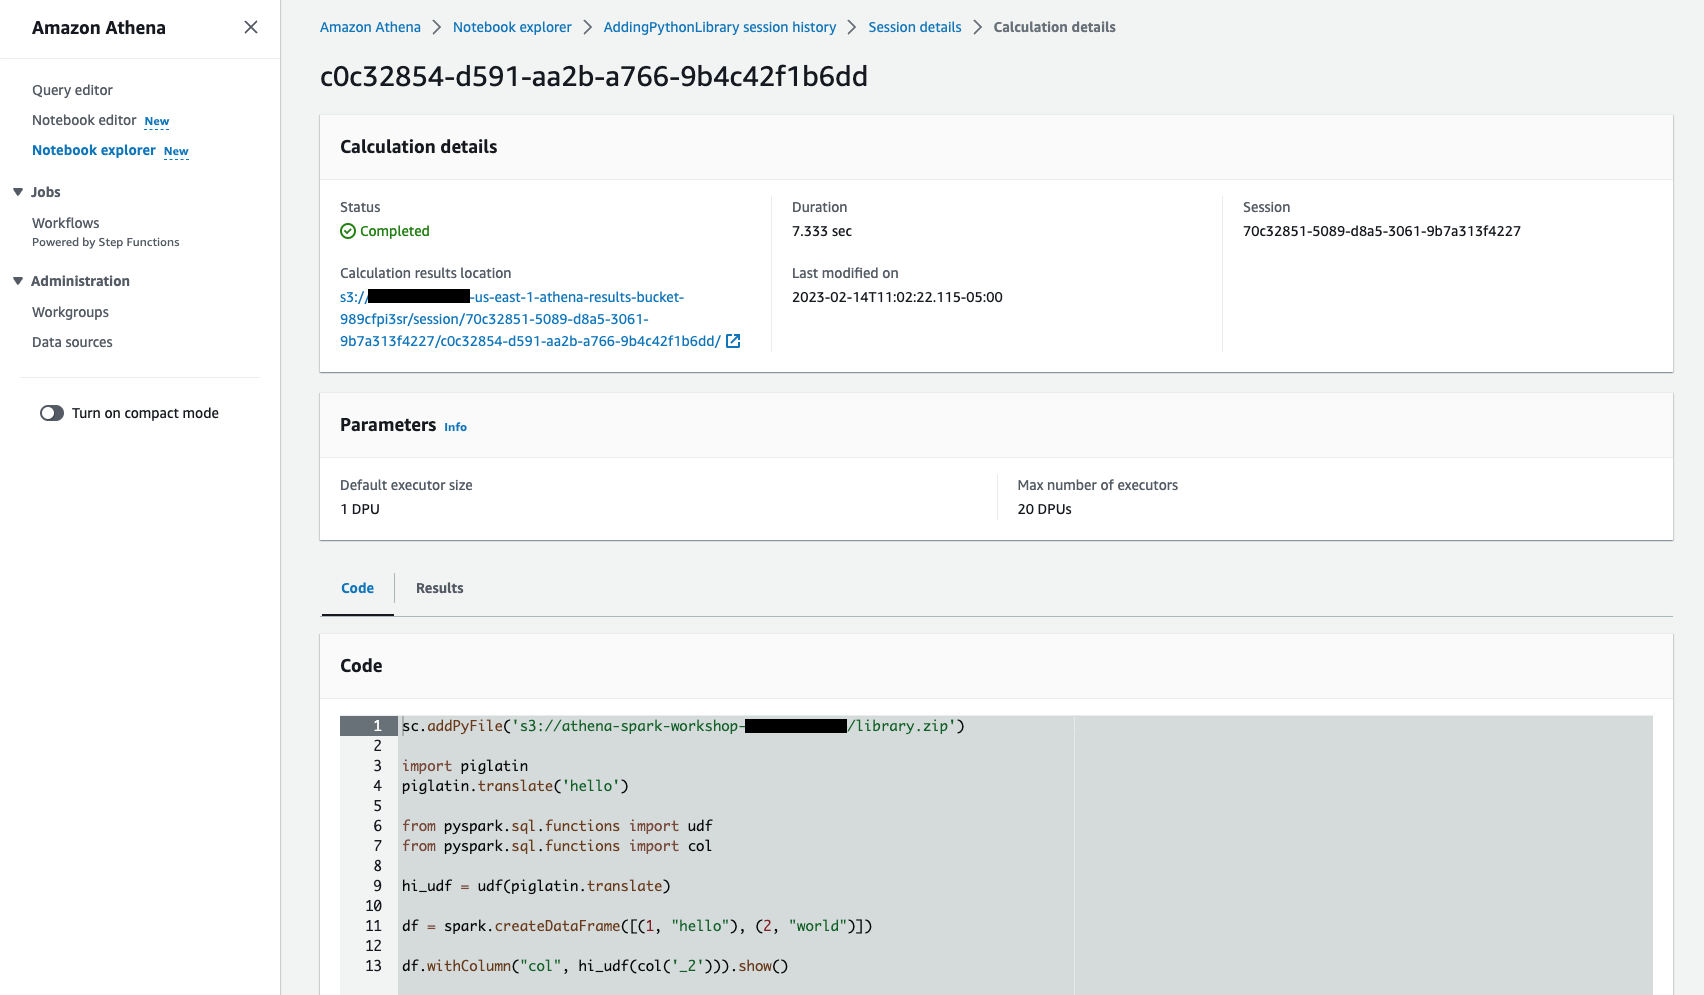
Exploring Session Details
In this lab we will show how to explore Athena runtime session history and it’s calculation details including when the session started and how many DPU ( Data Processing Units) it consumed and list of calculations it executed along with total runtime etc. There are two ways you can explore session details, one using Notebook explorer and another one using Workgroup
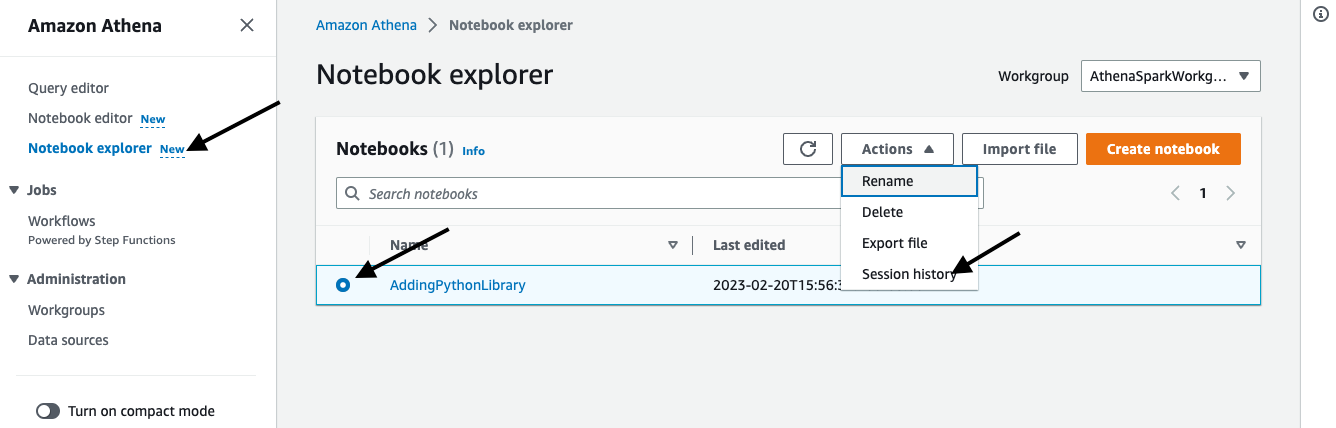
Using Notebook Explorer
-
Click on Notebook explorer on the side menu and select the notebook you imported and click Session history from the Actions dropdown. This will display list of sessions crated for this notebook.
-
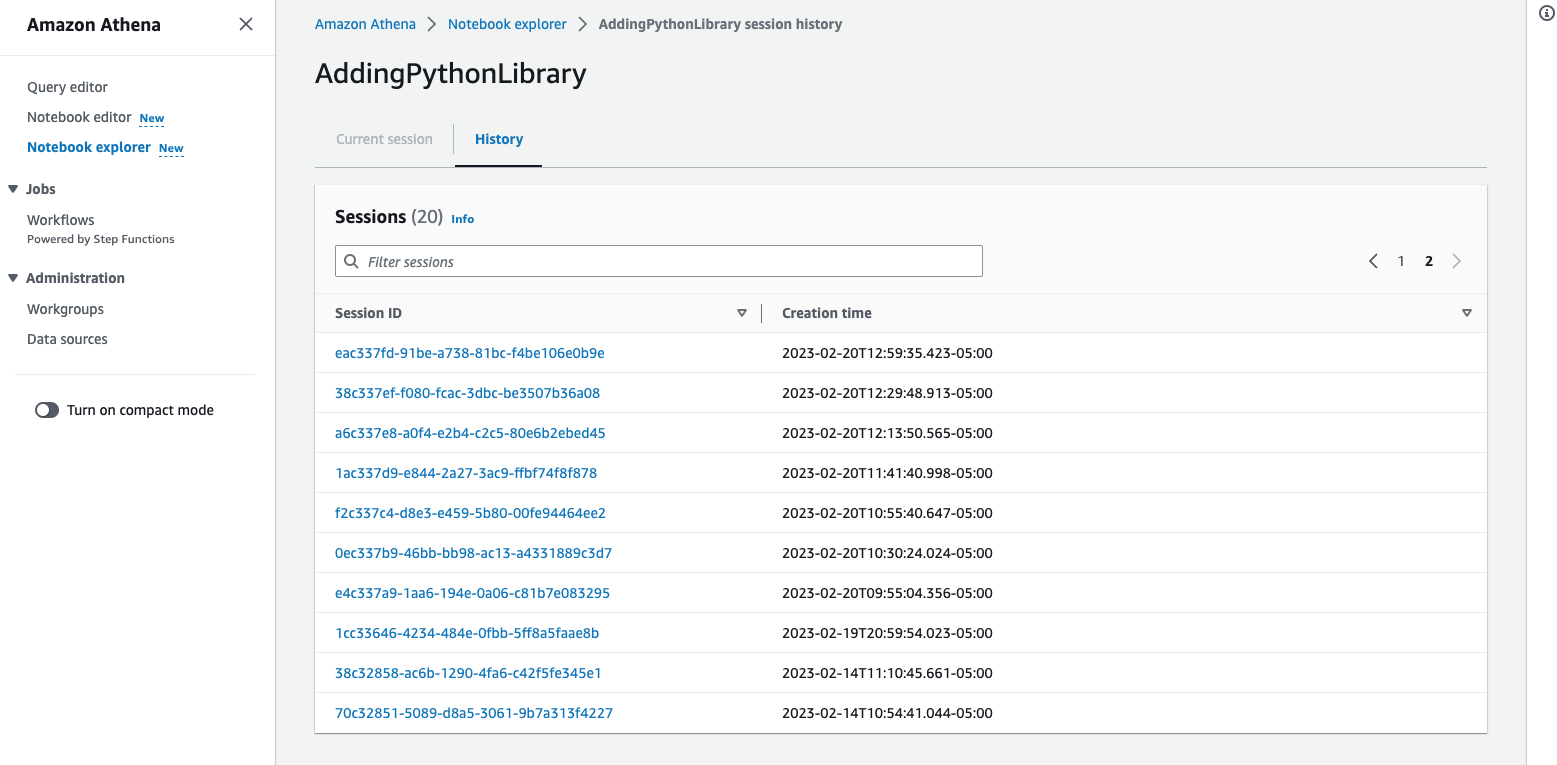
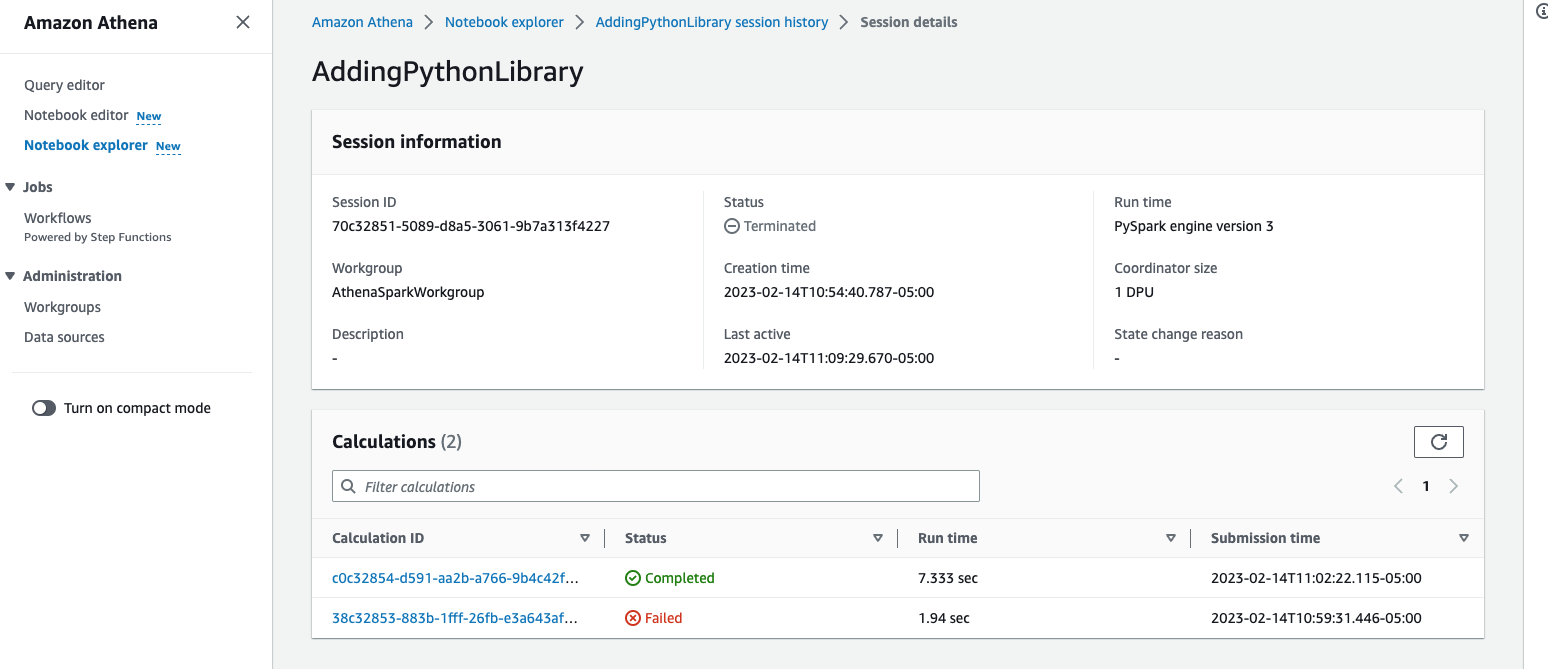
Click on one of the Session ID to see the details, this will show you when the session started, session status and list of calculations it executed from the notebook along with total runtime it took to complete the calculation and status whether it Completed or Failed.
-
Click on one of the calculation to further to explore what notebook cell executed, total runtime duration, code it executed and result etc, you can also download the result from the Results tab.
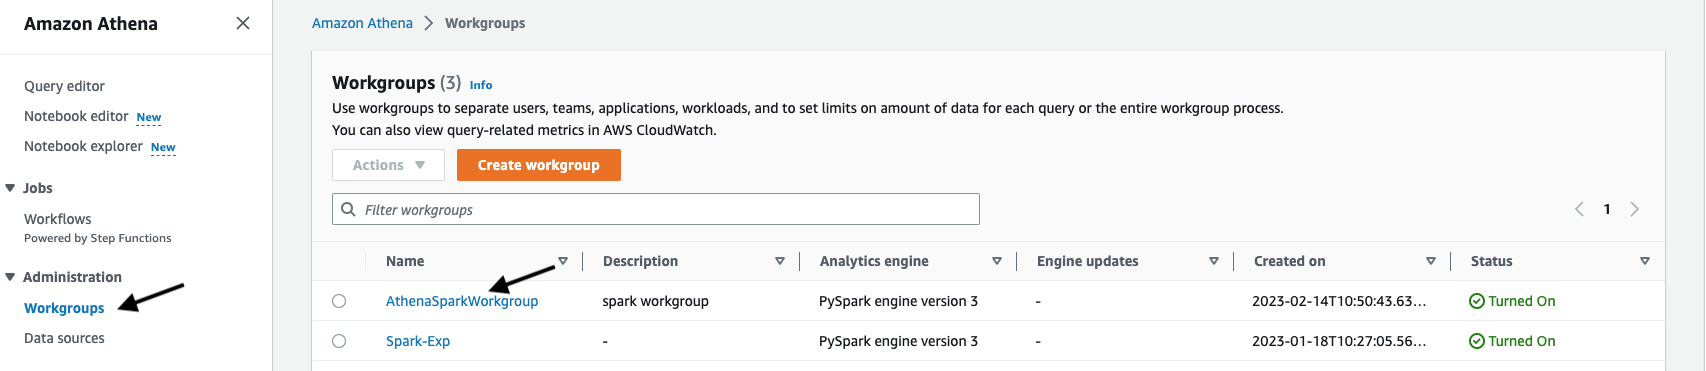
Using Workgroups
-
Click on Workgroups under Administration menu
-
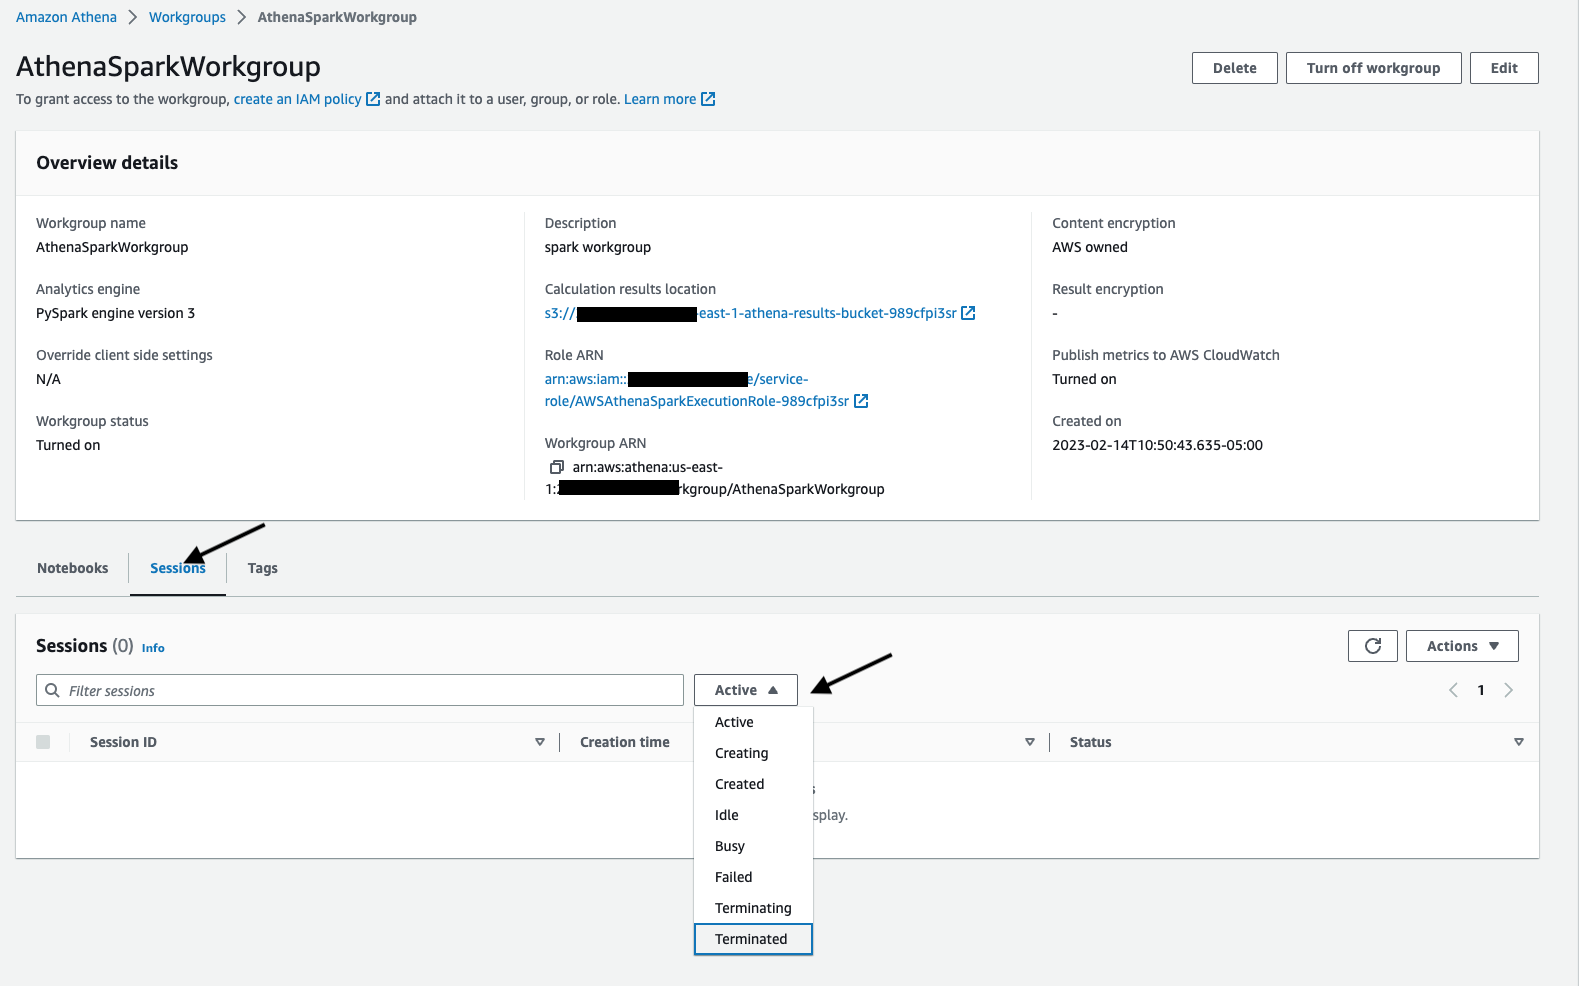
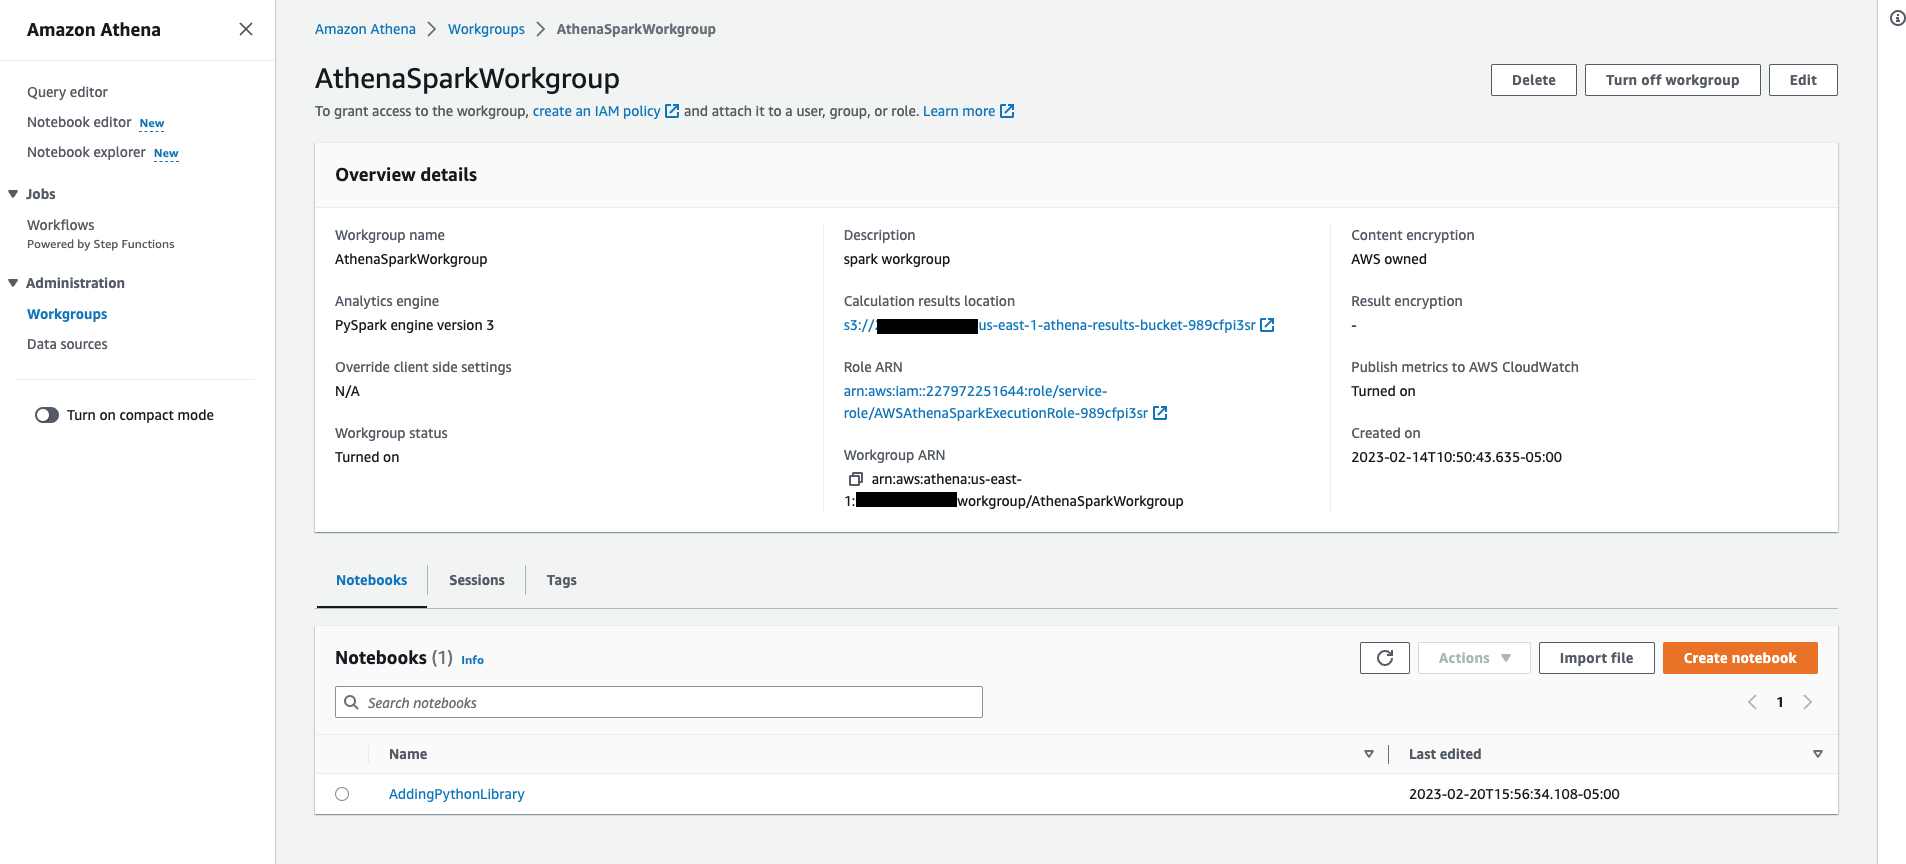
Click on one of the workgroup you crated for Spark where Analytics engine says PySpark engine version 3, it will show following Workgroup details which includes list of Notebooks and Sessions associated with this workgroup.
-
Click on Session tab and filter out sessions based on their status like Active, Idle, Terminated etc. You can further explore the session and calculation details by clicking on one of the session from the list.